HUDL Game Summary Comparison
Get better insights into your wins and losses with more comprehensive Game Summaries
Learn More about Hoopsalytics' Game Summaries
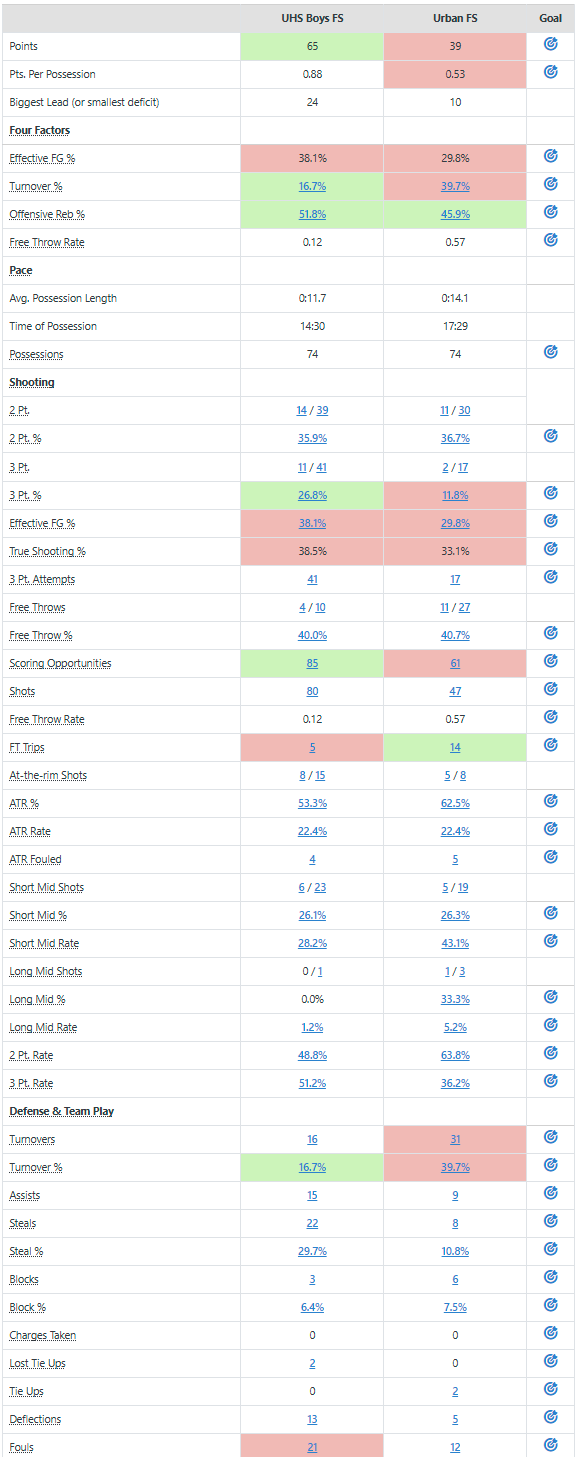
Hoopsalytics Game Summary (partial)
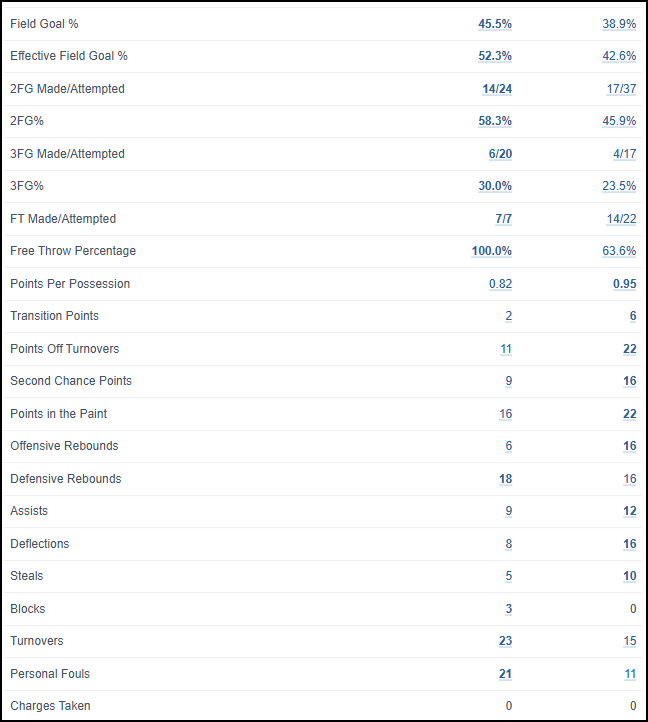
HUDL Assist
| Feature | Hoopsalytics | HUDL | Details |
|---|---|---|---|
| Filter on Custom Goals | (integrated) | separate view | Learn more |
| Color-Coded Goals | Learn more | ||
| Side by Side Team Stats | |||
| Compare Multiple Games (Game Flow) | |||
| Play-by-play | |||
| Summarize By Period | |||
| Summarize By Any Part of Game | |||
| Scoring Graph | |||
| Margin Graph | |||
| Score by Quarter | |||
| Pts. Per Possession | |||
| Biggest Lead (or smallest deficit) | |||
| Player Timelines | |||
| Lineup Timelines | |||
| 4 factors | |||
| Effective FG % | |||
| Turnover % | exact | estimated | |
| Offensive Reb % | |||
| Free Throw Rate | |||
| Pace | |||
| Avg. Possession Length | |||
| Time of Possession | |||
| Possessions | |||
| Shooting | |||
| 2 Pt. (Made/Attempts) | |||
| 2 Pt. % | |||
| 3 Pt. (Made/Attempts) | |||
| 3 Pt. % | |||
| True Shooting % | |||
| Free Throws (Made/Attempts) | |||
| Free Throw % | |||
| Scoring Opportunities | |||
| Total Shots | |||
| Free Throw Rate (FTF) | |||
| FT Trips | |||
| At-the-rim (ATR) Shots | |||
| ATR % | |||
| ATR Rate | |||
| ATR Fouled | |||
| Short Mid Shots | |||
| Short Mid % | |||
| Short Mid Rate | |||
| Long Mid Shots | |||
| Long Mid % | |||
| Long Mid Rate | |||
| 2 Pt. Rate | |||
| 3 Pt. Rate | |||
| Defense & Team Play | |||
| Turnovers | |||
| Lost Tie Ups | |||
| Assists | |||
| Steals | |||
| Steal % | |||
| Blocks | |||
| Block % | |||
| Charges Taken | |||
| Tie Ups | |||
| Deflections | |||
| Fouls | |||
| Offensive Fouls | |||
| Defensive Fouls | |||
| Fouls On 2 Pt. Shots | |||
| Fouls On 3 Pt. Shots | |||
| And-1 Fouls | |||
| Fouls: Non-Shooting | |||
| Fouls: Non-Shooting (in the Bonus) | |||
| Rebounding | |||
| Rebound % | |||
| Rebounds | |||
| Offensive Rebs. | |||
| Defensive Rebs. | |||
| Defensive Reb % | |||
| Offensive Reb % | |||
| Offensive 3 Pt. Reb % | |||
| Offensive 2 Pt. Reb % | |||
| Offensive FT Reb % | |||
| Coaching Data (Offense) | |||
| Transition Pts. | |||
| Set Offense Pts. | |||
| BLOB Pts. | |||
| SLOB Pts. | |||
| 2nd Chances | |||
| Start from Defensive Rebound | |||
| Start from Live Ball Turnover | |||
| Start from Dead Ball Turnover | |||
| Start from Opponent's Made Basket | |||
| Scoring Possessions / Possessions | |||
| Scoring Possession Rate | |||
| Coaching Data (Defense) | |||
| Defensive Stops / Possessions | |||
| Defensive Stop Pct. | |||
| Kills (3 stops in a row) |