Intro
Comprehensive Stats
Interactive Shot Charts
AI Assisted Coaching
Coaching Stats
Shot Analysis
On/Off Player Impact
Game Visualizations
Custom Color-coded Team Goals
Performance Trends
Custom Action Tags
Rebounding Analysis
Assist Maps
Game Flow
Weighted Stats
Deluxe Stats
Stat Analysis (Custom 4 Factors)
3x3 Breakdowns
Administrative Tools
Film Sessions & Highlight Reels
Integrated Playbook
Start a Game/Upload Video
Scoring Games & Adding Details
Customizing the Scoring Panel
Coach, Player & Parent Access
Sharing Video & Stats
Teams and Rosters
Fixing Jersey Number Changes
Real Game Demos
Pricing Info
 Hoopsalytics Tour
Explore all the amazing coaching tools
and insights Hoopsalytics has to offer.
Game Summary Visualizations
Get a better picture of why you won or lost a game using the visualizations in the Game Summary tool.
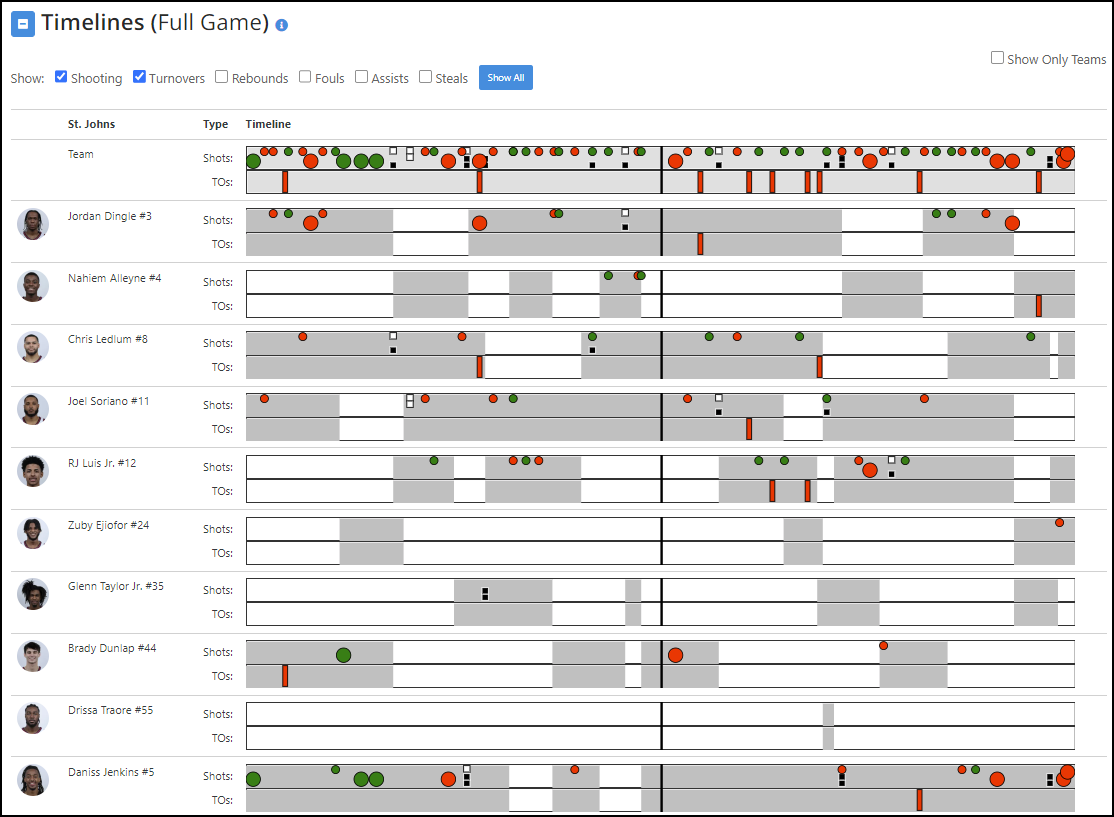
Hoopsalytics Timelines show each player's activity during the game, including when they played, their made and missed shots (green and red dots in the image above), and optionally turnovers, steals, assists, and rebounds. No other system can give you a clearer visualization of each player in the game. And this is especially useful for opponent scouting to see how lineup rotations appear, and who is taking the most shots.
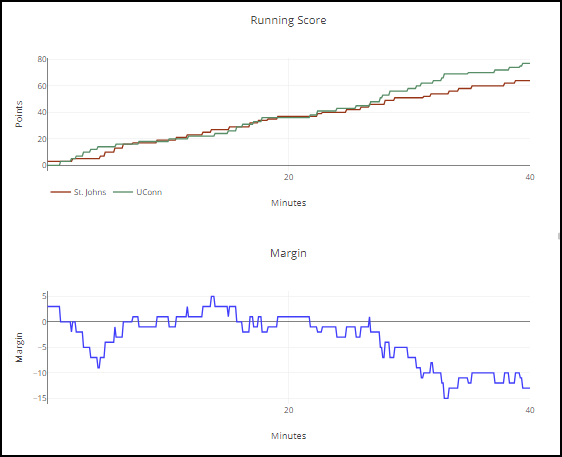
You also get interactive score and margin graphs. Select a portion of the graph, and summary stats change for that portion of a game. It's a great way to see what happened during a run. Here's how the score and margin graphs appear:

Watch this video to learn more about Game Summaries and Visualizations:
Game Summary Features
- View scoring and margin graphs for the entire game.
- Set per-game goals for any stat, and see how each team over or under performed on that goal.
- All comparison stats for each team link to video clips of those events.
- Select a portion of a game, and see how the comparison stats change.
- Get more insights with event timeline visualizations.
- See play-by-play breakdowns of the entire game, and easily watch clips of any event.

