Analytics Tools
Intro
Comprehensive Stats
Interactive Shot Charts
AI Assisted Coaching
Coaching Stats
Shot Analysis
On/Off Player Impact
Game Visualizations
Custom Color-coded Team Goals
Performance Trends
Custom Action Tags
Rebounding Analysis
Assist Maps
Game Flow
Weighted Stats
Deluxe Stats
Stat Analysis (Custom 4 Factors)
3x3 Breakdowns
Administrative Tools
Film Sessions & Highlight Reels
Integrated Playbook
Start a Game/Upload Video
Scoring Games & Adding Details
Customizing the Scoring Panel
Coach, Player & Parent Access
Sharing Video & Stats
Teams and Rosters
Fixing Jersey Number Changes
Real Game Demos
Pricing Info
 Hoopsalytics Tour
Explore all the amazing coaching tools
and insights Hoopsalytics has to offer.
Assist Maps
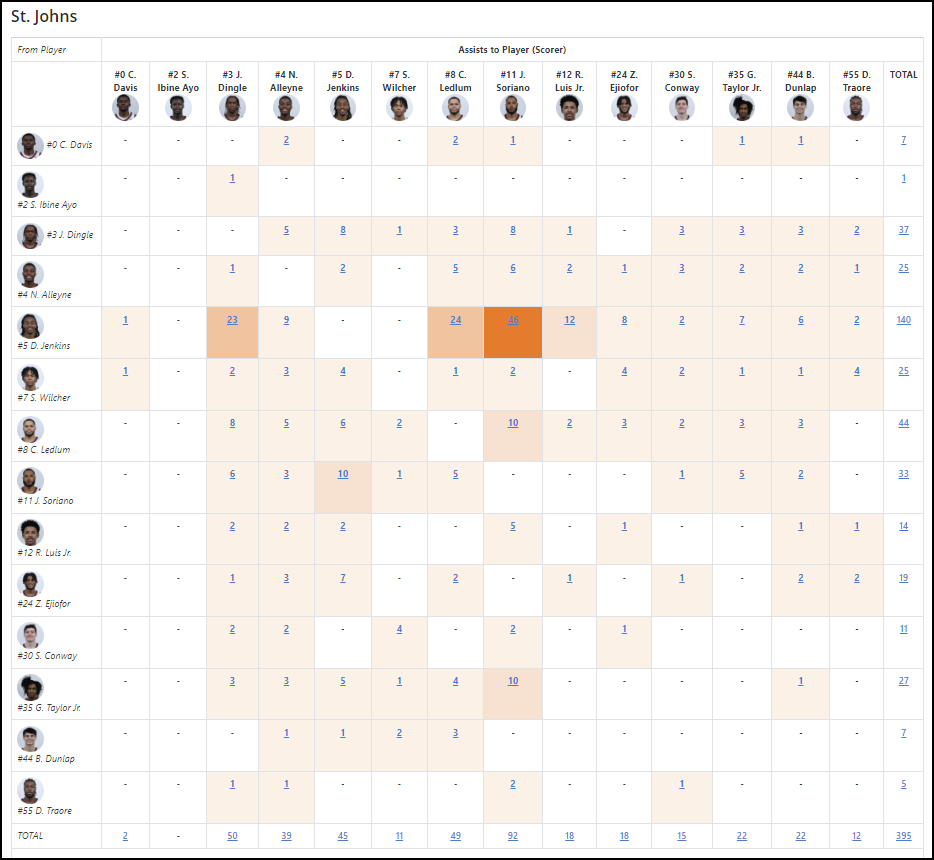
Learn all about your team's assist tendencies. See which players are passing to which other players more frequently, and view video clips of those pairings.
You can also add location data to each assist, and view them in a shot-chart-like manner. For example, you can see where assisted three-point baskets are passed from. Or which players are getting assists from inside the paint.
Watch this video to learn more.
Assist Map Features
- See a matrix of passers and scorers, and how often each combination connected for a score.
- Click on any cell in the matrix to see video clips of the passer and scorer connecting.
- View an Assist Chart: If you're location-tracking assists, you can see a chart of where those passes occurred.
- See the location of assists from any player.
- See where assists that led to three-point baskets came from.
- See successful passes just from your set offense.
- Highlight an area of the court (like the paint), and see which player has assists from that area.
- View video clips of highlighted assists.

