Intro
Comprehensive Stats
Deluxe Stats
Interactive Shot Charts
Coaching Stats
AI Assisted Coaching
Shot Analysis
On/Off Player Impact
Game Summaries
Game Visualizations
Custom Color-coded Team Goals
Performance Trends
Custom Action Tags
Rebounding Analysis
Assist Maps
Game Flow
Weighted Stats
Stat Analysis (Custom 4 Factors)
3x3 Breakdowns
Administrative Tools
Highlight Reels & Film Sessions
Start a Game/Upload Video
Teams and Rosters
Coach, Player & Parent Access
Sharing Video & Stats
Scoring Games & Adding Details
Fixing Jersey Number Changes
Customizing the Scoring Panel
Integrated Playbook
For Events (and Event Operators)
Real Game Demos
Pricing Info
 Hoopsalytics Tour
Explore all the amazing coaching tools
and insights Hoopsalytics has to offer.
More Comprehensive, More Customizable Video-Linked Stats
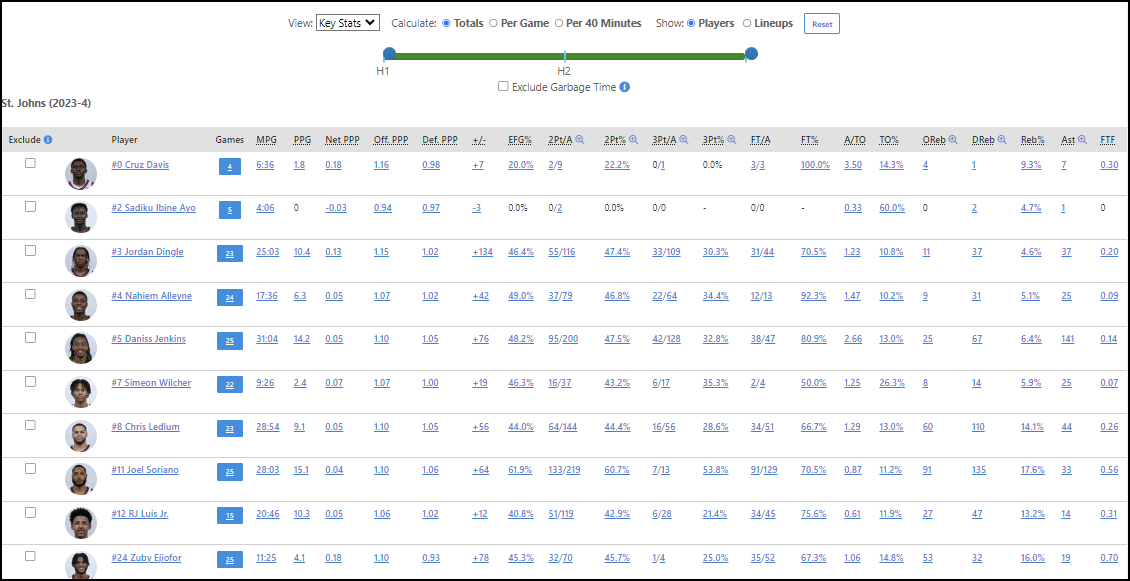
Hoopsalytics can show box score stats from over 120 events, for both individual players, groups of 2 or 3, lineups, and the entire team. Your box scores are totally configurable, and every stat links to video clips of those events. You can even filter on portions of each game (like the last two minutes), and eliminate garbage time.
There's no more compelling way to measure how each player and the team are performing.
Watch this short video, and learn more about the powerful data you can get from every game.
Feature Summary
- Click on a stat to view video clips of those events.
- Click on any column header to sort by that stat.
- View stats for just certain parts of the game (i.e. just 4th quarter).
- Exclude garbage time in stats.
- Exclude players, and see how team and individual stats change.
- See Player or Lineup stats.
- Get details on many stats - like shot types, turnover types, etc.
- Adjust stats based upon playing time to see how each player would have performed over a full game.
- Create custom views with just the stats you want to see.
Available Stats
The following event types and stats are available, either by default or via custom tagging. These can show per-game, per 32 or 40 minutes, or as a total in multiple games.
| Abbreviation | Description | Details |
|---|---|---|
| +/- | Plus Minus (+/-) | Team Points differential when player is on the floor |
| 1 Pt Bonus | 1 Pt. Bonus | Bonus point awarded for special rules |
| 1 Pt Fouls | 1 Pt. Shot Fouls | Number of fouls defending 1 point shots |
| 1Pt | Made 1 Pt. Shot | |
| 1Pt A | 1 Pt. Shot Attempts | |
| 1Pt Rate | 1Pt Rate | Percent of 1 Pt. Shots versus All Shots |
| 1Pt% | 1 Pt Shot Pct. | Percentage of 1 point shots made |
| 2 Pt Fouls | 2 Pt. Shot Fouls | Number of fouls defending 2 point shots |
| 2Pt | Made 2 Pt. Shot | |
| 2Pt A | 2 Pt. Shot Attempts | |
| 2Pt Fouled | Fouled on 2 Pt. Shot | A player was fouled in the act of shooting a 2 point shot |
| 2Pt miss | Missed 2 Pt. Shot | |
| 2Pt Rate | 2Pt Rate | Percent of 2 Pt. Shots versus All Shots |
| 2Pt% | 2 Pt Shot Pct. | Percentage of 2 point shots made |
| 3 Pt Fouls | 3 Pt. Shot Fouls | Number of fouls defending 3 point shots |
| 3Pt | Made 3 Pt. Shot | |
| 3Pt A | 3 Pt. Shot Attempts | 3 Pt. Shots Attempted |
| 3Pt Fouled | Fouled on 3 Pt. Shot | A player was fouled in the act of shooting a 3 point shot |
| 3Pt miss | Missed 3 Pt. Shot | |
| 3Pt Rate | 3Pt Rate | Percent of 3 Pt. Shots versus All Shots |
| 3Pt% | 3 Pt. Shot Pct. | Percentage of 3 point shots made |
| A/TO | Assist to Turnover ratio | Number of assists divided by the number of turnovers |
| And 1 | And 1 | A basket was scored and the shooter was fouled |
| And-1 Fouls | And-1 Fouls | Number of And-1 Fouls on successful shots (2s and 3s) |
| Ast | Assist | A player made a pass which resulted in a score |
| Ast% | Assist Percent | What percent of made baskets were assisted by this player/team |
| Ast2 | Assist (2pt) | Assists on 2 point shots |
| Ast3 | Assist (3pt) | Assists on 3 point shots |
| ATR % | At-the-rim Shooting % | Shooting percentage for shots at the rim (<= 5 ft.) |
| ATR Att. | At-the-rim Attempts | Shot attempts at the rim (<= 5 ft.) |
| ATR Fouled | At-the-rim Shots Fouled | Shots attempts fouled at the rim (<= 5 ft.) |
| ATR Made | At-the-rim Made Shots | Shots made at the rim (<= 5 ft.) |
| ATR Rate | At-the-rim Rate | Percentage of all shots at the rim (<= 5 ft.) vs. all shots (2s and 3s) |
| Blk | Block Shot | Shots blocked by the defense |
| Blk% | Block Pct. | On defense, the percentage of blocked shots vs. shots taken |
| Blkd | Shot Attempts Blocked | How many shots taken by a player or team were blocked. |
| Chrg | Take Charge | Number of charges taken by a defensive player |
| Def Foul | Defensive Foul | A foul committed by the defense (not counted as an outcome) |
| Def. 2Pt% | Defensive 2Pt Pct. | On defense, the 2 Pt. shooting percentage for the opposing team |
| Def. 3Pt% | Defensive 3Pt Pct. | On defense, the 3 Pt. shooting percentage for the opposing team |
| Def. Fail | Defensive Fail Tag | Bad things that happened on defense |
| Def. Pace | Defensive Pace | Seconds Per Defensive Possession |
| Def. Poss. | Defensive Possessions | The number of defensive possessions participated in |
| Def. PPP | Points Allowed per Defensive Possession | How many points per possession the other team scored |
| Def. Praise | Defensive Praise Tag | Good things that happened on defense |
| Def. Rtg | Points allowed per 100 Defensive Possessions | How many points the team allowed for every 100 defensive possessions |
| Def. Stop Pct. | Defensive Stop Pct. | What percent of Defensive Possessions resulted in no points scored and no free throws |
| Def. Stops | Defensive Stops | Defensive possessions with no points scored and no free throws |
| Def. TO | Defensive Turnovers | On defense, the number turnovers by opponents |
| Def. TO% | Defensive Turnover Pct. | On defense, the percentage of turnovers vs. scoring opportunities (shots + FTs) by opponents |
| Deflect | Deflect | A defensive player deflected a pass or interfered with a dribble |
| DReb | Defensive Rebound | A player on defense rebounded a missed shot |
| DReb% | Defensive Rebound % | What percentage of possible defensive rebounds did the team get |
| EFG% | Effective FG Pct. | Field goal percentage, weighted 1.5x towards 3 point shots. Example: Shooting 1 for 1 in 3 point shots is equal to a 150% EFG. |
| Events | All Events | Anything assigned to a Player or Lineup |
| FG Made | FG Made | Made 2 and 3 pt. shots |
| Fouled | Foul Drawn | When an offensive player get fouled |
| Fouls | Fouls | All Fouls (offensive and defensive) |
| FT | Made Free Throws | |
| FT A | Free Throws Attempted | |
| FT miss | Missed Free Throws | |
| FT Trips | Free Throw Line Trips | How often a player was fouled resulting in free throws |
| FT Violation | Free Throw Violation | A violation occurred during a free throw |
| FT% | Free Throw Pct. | Percentage of Free Throws made |
| FTF | Free Throw Factor | Shows how often a team or player gets to the free throw line relative to number of shots taken |
| FTO | Forced Turnover | A player performed an action that forced a turnover by the opposing team |
| Games | Games Played | |
| HC 2Pt Rate | Half-Court Set - 2Pt. Shot Rate | Percentage of all 2Pt. shots in half-court sets vs. all shots |
| HC 2Pt. % | Half-Court Set 2 Pt. Shooting % | Shooting percentage for 2 Pt. shots from a set offense, SLOB or BLOB |
| HC 2Pt. ATR % | 2 Pt. At-The-Rim Shooting % in Half-Court Sets | Shooting percentage for 2Pt. shots at-the-rim from half-court sets |
| HC 2Pt. ATR Att. | 2 Pt. At-The-Rim Shot Attempts in Half-Court Sets | |
| HC 2Pt. ATR Fouled | Fouled 2 Pt. At-The-Rim Shot Attempts in Half-Court Sets | At-the-rim Shots attempts fouled from a set offense, SLOB or BLOB |
| HC 2Pt. ATR Made | Made 2 Pt. At-The-Rim Shots in Half-Court Sets | 2 Pt. Shots made at-the-rim in half-court sets |
| HC 2Pt. Att. | 2 Pt. Shot Attempts in Half-Court Sets | 2 Pt. Shot attempts from a set offense, SLOB or BLOB |
| HC 2Pt. Fouled | Fouled 2 Pt. Shot Attempts in Half-Court Sets | Shots attempts fouled from a set offense, SLOB or BLOB |
| HC 2Pt. Made | Made 2Pt. Shots in Half-Court Sets | 2Pt. Shots made from a set offense, SLOB or BLOB |
| HC 3Pt Rate | Half-Court Set - 3Pt. Shot Rate | Percentage of all 3Pt. shots in half-court sets vs. all shots |
| HC 3Pt. % | Half-Court Set 3 Pt. Shooting % | Shooting percentage for 3 Pt. shots from a set offense, SLOB or BLOB |
| HC 3Pt. Att. | 3 Pt. Shot Attempts in Half-Court Sets | 3 Pt. Shot attempts from a set offense, SLOB or BLOB |
| HC 3Pt. Fouled | Fouled 3 Pt. Shot Attempts in Half-Court Sets | 3 Pt. Shots attempts fouled from a set offense, SLOB or BLOB |
| HC 3Pt. Made | Made 3Pt. Shots in Half-Court Sets | 3Pt. Shots made from a set offense, SLOB or BLOB |
| Hustle | Hustle Play | Hustle Play |
| Kills | Kills (3 stops in a row) | 3 consecutive defensive possessions with no score and no free throws allowed |
| LB Foul | Loose Ball Foul | Loose Ball Foul (committed by offense or defense) |
| Long Mid % | Long Midrange Shooting % | Shooting percentage for Long Midrange Shots (>13 ft.) |
| Long Mid Att. | Long Midrange Attempts | Long Midrange Shot attempts (>13 ft.) |
| Long Mid Fouled | Long Midrange Shots Fouled | Long Midrange Shots fouled (>13 ft.) |
| Long Mid Made | Long Midrange Made Shots | Long Midrange Shots made (>13 ft.) |
| Long Mid Rate | Long Midrange Rate | Percentage of all Long Midrange Shots (>13 ft.) vs. all shots (2s and 3s) |
| Lost Tie Up | Lost Tie Up | An offensive player lost possession to a tie-up (Forced Jump ball) |
| Net PPP | Net Points Per Possession | Points gained or lost in possessions. (Off. PPP - Def. PPP) |
| NS Fouls | Non-Shooting Fouls | Number of loose ball or defensive fouls (non-shooting) |
| NS Fouls (Bonus) | Non-Shooting Fouls in the Bonus | Number of non-shooting fouls that led to free throws (in the bonus) |
| Off Foul | Offensive Foul | |
| Off. Action Tag | Offensive Action Tag | Actions that occur during play (like screens, handoffs, etc.) |
| Off. Pace | Offensive Pace | Seconds Per Offensive Possession |
| Off. Pos. Score Pct. | Offensive Possession Score Pct. | What percent of Offensive Possessions resulted in a score or free throws |
| Off. Pos. Scored | Offensive Scoring Possessions | Offensive Possessions that resulted in a score or free throws |
| Off. Poss. | Offensive Possessions | The number of offensive possessions participated in |
| Off. PPP | Points per Offensive Possession | How many points the team scored for each offensive possession |
| Off. Rtg | Points per 100 Offensive Possessions | How many points the team scored for every 100 offensive possessions |
| Opp DRebs | Defensive Rebs Allowed | How many defensive rebounds were obtained by the opposing team |
| Opp ORebs | Offensive Rebs Allowed | How many offensive rebounds were obtained by the opposing team |
| Opps. | Scoring Opportunities | How many opportunities to score (shots taken plus trips to the free throw line) |
| OReb | Offensive Rebound | A player on offense rebounded a missed shot |
| OReb% | Offensive Rebound % | What percentage of possible offensive rebounds did the team get |
| Other Ast | Other Assist | A non-standard assist that led to a score |
| Pace | Pace | Seconds Per Possession (Offense and Defense combined) |
| Penalty Pt. | Penalty Point | Penalty point awarded (i.e. technical fouls) |
| Poss. | Possessions | How many possessions a team had |
| Pts. | Points | |
| Qtrs. | Quarters Played | How many quarters a player participated in |
| Reb | Rebounds | A missed shot was rebounded, or possession changed to the other team |
| Reb% | Rebound Pct. | The percentage of available rebounds a player or team captured |
| Screen Received | Screen Received | A screen was received by a player |
| Screen Set | Screen Set | A screen was set by a player |
| Short Mid % | Short Midrange Shooting % | Shooting percentage for Short Midrange Shots (5-13 ft.) |
| Short Mid Att. | Short Midrange Attempts | Short Midrange Shot attempts (5-13 ft.) |
| Short Mid Fouled | Short Midrange Shots Fouled | Short Midrange Shots fouled (5-13 ft.) |
| Short Mid Made | Short Midrange Made Shots | Short Midrange Shots made (5-13 ft.) |
| Short Mid Rate | Short Midrange Rate | Percentage of all Short Midrange Shots (5-13 ft.) vs. all shots (2s and 3s) |
| Shots | Shots | How many shots were taken by a player or team, not including fouled shots |
| Stl | Steal | The defense stole a live ball pass or dribble |
| Stl% | Steal Pct. | The percentage of steals vs. defensive possessions |
| Team Pts. | Team Points | How many points the team scored when the player was on the floor |
| Team Pts. Allowed | Team Points Allowed | How many points the opposing team scored when the player was on the floor |
| Tech Foul | Technical Foul | |
| Tech Foul Shots | Technical Foul Shots | Set Marker for Tech Foul Points |
| Tie Up | Tie Up (Forced Jump Ball) | A defensive player tied up the ball with another player, forcing a possible change of possession |
| Time | Time | Estimated Playing Time |
| TO | Turnover | Turnovers (possessions lost without a shot attempt) |
| TO% | Turnover Pct. | The percentage of turnovers vs. scoring oportunities. Formula: TOs / (TOs + Shots + FT Trips) |
| Trans. 2Pt. % | 2 Pt. Shooting % in Transition | Shooting percentage for 2Pt. shots from transition or a press break |
| Trans. 2Pt. ATR % | 2 Pt. At-The-Rim Shooting % in Transition | Shooting percentage for 2Pt. shots at-the-rim from transition or a press break |
| Trans. 2Pt. ATR Att. | 2 Pt. At-The-Rim Shot Attempts in Transition | 2 Pt. Shot attempts at-the-rim from transition or a press break |
| Trans. 2Pt. ATR Made | Made 2 Pt. At-The-Rim Shots in Transition | 2 Pt. Shots made at-the-rim in transition or press break |
| Trans. 2Pt. Att. | 2 Pt. Shot Attempts in Transition | 2 Pt. Shot attempts from transition or a press break |
| Trans. 2Pt. Made | Made 2 Pt. Shots in Transition | 2 Pt. Shots made in transition or press break |
| Trans. 2Pt. Rate | In-Transition 2 Pt.Shot Rate | Percentage of all 2 Pt. shots in transition vs. all shots |
| Trans. 3Pt. % | 3 Pt. Shooting % in Transition | Shooting percentage for 3 Pt. shots from transition or a press break |
| Trans. 3Pt. Att. | 3 Pt. Shot Attempts in Transition | 3 Pt. Shot attempts from transition or a press break |
| Trans. 3Pt. Made | Made 3 Pt. Shots in Transition | 3 Pt. Shots made in transition or press break |
| Trans. 3Pt. Rate | In-Transition 3 Pt.Shot Rate | Percentage of all 3 Pt. shots in transition vs. all shots |
| Trans. Fouled | Shots Attempts Fouled in Transition | Shots attempts fouled in transition or press break |
| TS% | True Shooting Pct. | An advanced statistic that measures efficiency shooting the ball. Two- and three-point field goals and free throws are all considered in its calculation. |
| Usage % | Usage Rate | What percentage of possessions were ended by a player (Shot, TO, Lost Tie up or FT Trip) |
| VPS | Value Points (VPS) | VPS is based on a formula that assesses performance based upon several offensive and defensive stats. The higher the number, the better. A VPS of 1 is about average. |