Analytics Tools
Intro
Comprehensive Stats
Deluxe Stats
Interactive Shot Charts
Coaching Stats
AI Assisted Coaching
Shot Analysis
On/Off Player Impact
Game Summaries
Game Visualizations
Custom Color-coded Team Goals
Performance Trends
Custom Action Tags
Rebounding Analysis
Assist Maps
Game Flow
Weighted Stats
Stat Analysis (Custom 4 Factors)
3x3 Breakdowns
Administrative Tools
Highlight Reels & Film Sessions
Start a Game/Upload Video
Teams and Rosters
Coach, Player & Parent Access
Sharing Video & Stats
Scoring Games & Adding Details
Fixing Jersey Number Changes
Customizing the Scoring Panel
Integrated Playbook
For Events (and Event Operators)
Real Game Demos
Pricing Info
 Hoopsalytics Tour
Explore all the amazing coaching tools
and insights Hoopsalytics has to offer.
Performance Trends
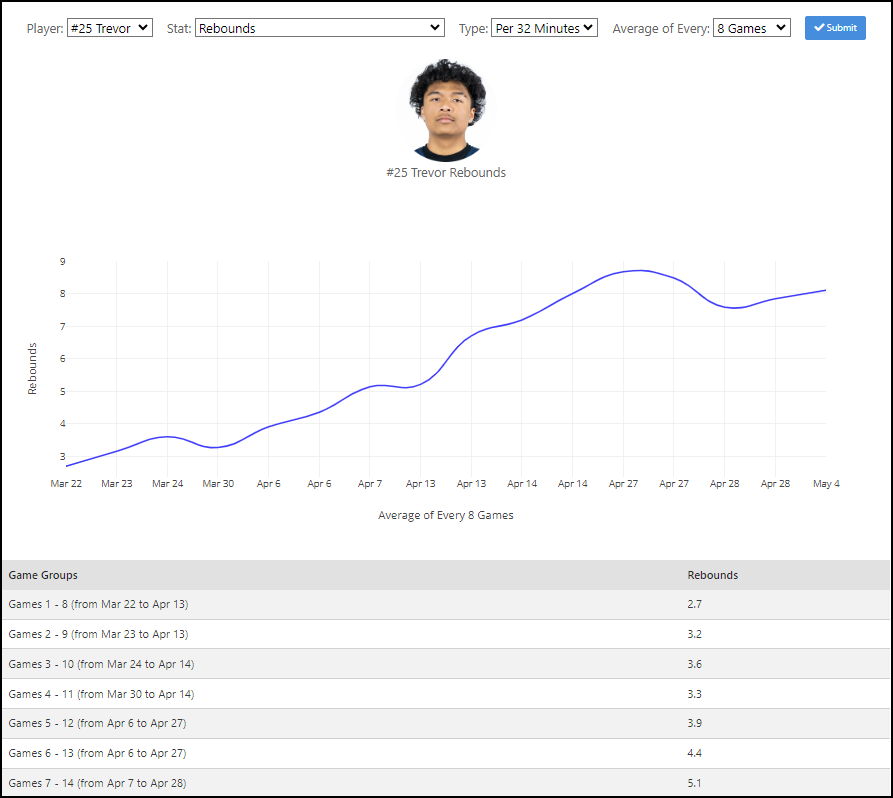
Are your players continually improving over the course of your season? You can track and view player performance growth in 40 different stats with the Trends tool. And visualize trends with a rolling average, as well as a per-game or per 32/40 minute rate.
For example, it's easy to see who is continually increasing their shooting percentages, or getting better at rebounding.
The generic stats service your opponents are probably using doesn't even have this level of detail, or this capability.
Watch this video to learn more:
Highlights of the Trends Tool
- See how your team or various players improve over the course of a season.
- Choose from 40 different stats to measure.
- Adjust for per-game or per 32/40 minutes to get a better measure for comparison.
- To make the graph more accurate, select a rolling average over multiple game chunks. This eliminates really good or really bad games from the overall picture.